The Urban Developer
AdvertiseEventsWebinarsUrbanity
Industry Excellence
Urban Leader
Sign In
Membership
Latest
Menu
Location
Sector
Category
Content
Type
Newsletters
JOIN US FOR A ONE-DAY DEEP DIVE INTO THE FUTURE OF THE INDUSTRIAL SECTOR
FIND OUT HOW THE INDUSTRIAL MARKET IS CHANGING IN 2026
LEARN MOREDETAILS
On Demand

Fireside Chat | Inside GemLife With Adrian Puljich

Building Australia's Newest Airport: Multiplex

The Makers Of The Mondrian | Design, Vision And Delivery Behind One Of Australia’s Most Anticipated Luxury Hotels

Next Gen Now | How Emerging Developers Are Redefining The Game

View All >
Latest News
Residential

Spyre Moves Ahead with Bulimba Luxury Apartments

Lindsay Saunders
2 Min
Industrial

Explore the Future of Industrial Development

David Di Marco
3 Min
Architecture

Why Human-Centred Design Drives Commercial Success

Partner Content
5 Min
Hines Property Twin Street tower HERO
Student Housing

Hines Wins Approval for 36-Storey Adelaide PBSA Highrise

Leon Della Bosca
3 Min
View All >
Events
Summit

Commercial Real Estate Summit

Summit

Urban Leader Awards

One-Day Course

Property Development Masterclass | Melbourne

One-Day Course

Property Development Masterclass | Sydney

View All >
TheUrbanDeveloper
Follow
About
About Us
Membership
Awards
Events
Webinars
Listings
Resources
Terms & Conditions
Commenting Policy
Privacy Policy
Republishing Guidelines
Editorial Charter
Complaints Handling Policy
Contact
General Enquiries
Advertise
Contribution Enquiry
Project Submission
Membership Enquiry
Newsletter
Stay up to date and with the latest news, projects, deals and features.
Subscribe
SHARE
print
Print
ConstructionVanessa CrollTue 23 Sep 25

Crane Count Steady as Nation’s Construction Focus Shifts

RLB Crane Index HERO

Construction activity remains steady across the country as residential and digital projects carry the load against weaker office and civic pipelines.

The September quarter Crane Index from Rider Levett Bucknall (RLB) counted 845 cranes nationwide, down from the early-2024 peak of 869 but still well above the long-term average of 775. 

It’s the eighth consecutive index above 800, underlining the sector’s resilience despite cost and financing pressures.

Sydney remains the epicentre with 370 cranes—43.8 per cent of the national total—though down slightly on the previous survey. 

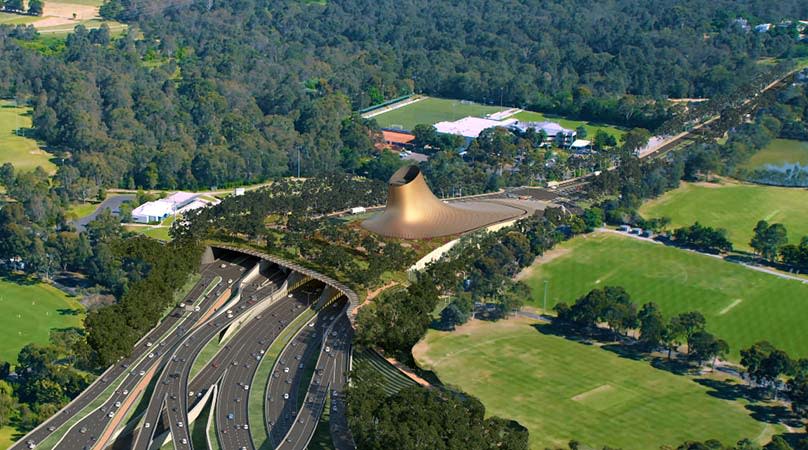
Melbourne held at 199, anchored by large commercial and infrastructure projects including the $36-billion North-East Link, which alone deployed 46 cranes.

Queensland’s momentum is growing. 

Brisbane lifted to 73 and the Gold Coast to 67, each adding eight and together accounting for 140 cranes. 

RLB Crane Index Graph
▲ Source: The Urban Developer

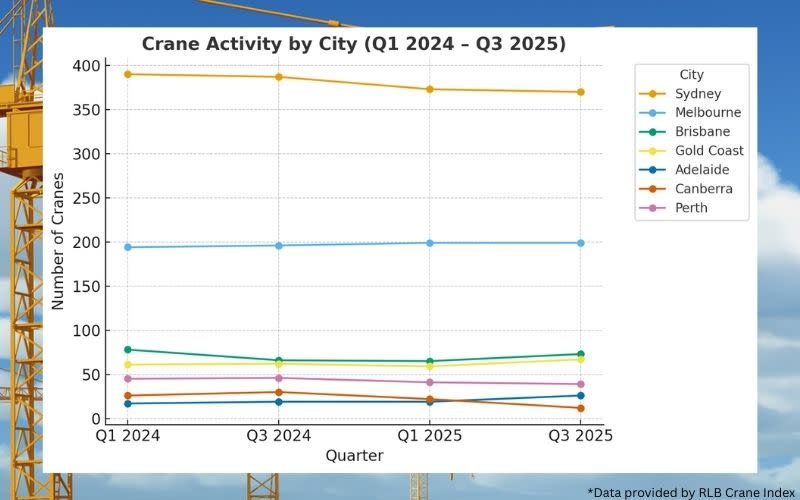
Adelaide climbed to 26, Wollongong to 20 and Darwin to four—all record highs—while Canberra fell from 22 to 12 as civic projects wrapped up.

“The Australian construction sector holds firm, with the national crane count rising slightly from 840 to 845, well above the long-term average of 775,” RLB research director Oliver Nichols said. 

“What we are seeing is a shifting of activity across different regions and asset classes.”

Residential remains dominant with 498 cranes, almost 59 per cent of the total. 

Mixed-use projects rose to 108 and data centres to 32. 

Health and hotels rose, while commercial fell by 12, civic by six and aged care by five.

Melbourne’s Palmers Road data centre at Truganina recorded the largest single-site deployment with six cranes, highlighting the growing scale of digital infrastructure investment.

Australian Bureau of Statistics (ABS) figures for the June quarter showed total construction activity was up 3 per cent to $76.1 billion. 

Engineering rose 6.1 per cent to $37.1 billion, driven by infrastructure. 

Building edged up to $39 billion, split between $24.2 billion of residential and $14.9 billion of non-residential.

North East Link's twin tunnels between Watsonia and Bulleen
▲ Melbourne’s North East Link twin tunnels between Watsonia and Bulleen. The $36-billion project that helped keep the city’s crane count steady.

Approvals point to a solid pipeline. 

More than 47,000 homes were approved in the June quarter, valued at almost $24 billion and up 18 per cent year-on-year. 

Non-residential approvals hit $21.8 billion, up 30.6 per cent, led by education, office, industrial and data infrastructure. 

The scale of approvals suggests crane activity will remain elevated into 2026, though project feasibility is still being tested by labour shortages, high costs and financing constraints.

“Despite the overall drop in crane numbers from a year ago, the crane index metrics, together with the construction work data, and approvals point to a sector that remains stable while reallocating resources,” Nichols said. 

“The emphasis is shifting towards infrastructure, density and digital capacity, with regional hotspots and sectoral transitions shaping Australia’s next phase of development.”

ResidentialAustraliaResearch
AUTHOR
Vanessa Croll
The Urban Developer - Journalist
More articles by this author
TOP STORIES
London skyline near the walkie talkie tower showing the 85 gracechurch street development.
Exclusive

Basilica to Business: London Office Tower’s Historic Rework

Renee McKeown
6 Min
Hotel Indigo Adelaide hero
Exclusive

Neighbourhood Hotels Reinvent Urban Hospitality

Clare Burnett
5 Min
Melbourne CBD empty site
Exclusive

Melbourne Developers Hit Back at Mayor’s ‘Lazy Landlord’ Plans

Leon Della Bosca
7 Min
The land value of many fuel retailing sites is outweighing their operational value.
Exclusive

Shrinking Servo Network Heralds Development Prospects

Patrick Lau
7 Min
Sydney airspace
Exclusive

Money Out of Thin Air: The Multibillion-Dollar Rooftop Housing Play

Vanessa Croll
8 Min
View All >
Article originally posted at: pr-323.staging.theurbandeveloper.com/articles/australian-crane-activity-residential-data-centres-lead-offices-down-rlb-index